
Financial report[1]
For the PRI Association Directors’ report, Group strategic report and Consolidated financial statements for the year ended 31 March 2021 click here.
Income
Between 1 April 2020 and 31 March 2021, total income grew to £21.5 million, up from £18.0 million in 2019/20.
| Actual 2019/20 | Actual 2020/21 | Budget 2021/22 | |
|---|---|---|---|
| Membership fees | 14,149 | 17,310 | 20,265 |
| Grants, donations, other* | 1,879 | 3,214 | 3,024 |
| PRI in Person/ Digital Forum income surplus |
1,231 | -231 | - |
| PRI Academy | 737 | 1,213 | 1,000 |
| Total Income | 17,996 | 21,506 | 24,288 |
*Projects funded through grants, donations and other income included: A Legal Framework for Impact, Climate Action 100+, TCFD, IASB opinion on climate change, The Investor Agenda, The Inevitable Policy Response, EU sustainable finance, Transition Pathway Initiative, and the UN Net Zero Asset Owner Alliance.
Signatory fees
All signatories pay annual fees, based on their total assets under management or, for service providers, number of employees. In 2020/21, income from new and existing signatories came to £17.3 million, up from £14.1 million in 2019/20.
Fee discounts
Asset owners headquartered in a country classified by the IMF as an emerging market or developing economy are entitled[2] to apply for a fee discount. We will bill service providers based on only their investment staff, where that service provider has distinct divisions that provide distinct services. If one of those divisions provides a service that is not relevant to investors (and therefore the Principles), this division will be excluded from the fee calculation.
| Account Name | HQ Country | Signatory Category |
|---|---|---|
| AFAP Sura | Uruguay | Asset Owner |
| Afore Profuturo | Mexico | Asset Owner |
| Afore Sura | Mexico | Asset Owner |
| Afore XXI Banorte | Mexico | Asset Owner |
| AFP Capital | Chile | Asset Owner |
| AFP Crecer | Dominican Republic | Asset Owner |
| AFP INTEGRA | Peru | Asset Owner |
| AFP PlanVital | Chile | Asset Owner |
| AFP Provida | Chile | Asset Owner |
| BBVA Bancomer, Fondos de Pensiones | Mexico | Asset Owner |
| Brasilprev Seguros e Previdência | Brazil | Asset Owner |
| Citibanamex Afore | Mexico | Asset Owner |
| Cuprum afp | Chile | Asset Owner |
| Economus | Brazil | Asset Owner |
| Employees Provident Fund | Malaysia | Asset Owner |
| FAPES | Brazil | Asset Owner |
| Fondo de Ahorro de Panamá | Panama | Asset Owner |
| Fondo Nacional de Infraestructura | Mexico | Asset Owner |
| Fundação Atlântico de Seguridade Social | Brazil | Asset Owner |
| FUNDACION WWB COLOMBIA | Colombia | Asset Owner |
| Government Employees Pension Fund of South Africa | South Africa | Asset Owner |
| Government Pension Fund of Thailand | Thailand | Asset Owner |
| Infraprev | Brazil | Asset Owner |
| Inovar Previdência | Brazil | Asset Owner |
| Khazanah Nasional Berhad | Malaysia | Asset Owner |
| LA Retirement Fund | South Africa | Asset Owner |
| Momentum Metropolitan Life | South Africa | Asset Owner |
| NÉOS – Previdência Complementar | Brazil | Asset Owner |
| Old Mutual | South Africa | Asset Owner |
| OPC CCSS | Costa Rica | Asset Owner |
| Pacifico Compañia de Seguros y Reaseguros | Peru | Asset Owner |
| Porvenir | Colombia | Asset Owner |
| PREVI - Caixa de Previdência dos Funcionários do Banco do Brasil | Brazil | Asset Owner |
| Real Grandeza | Brazil | Asset Owner |
| Retirement Fund (Incorporated) (KWAP) | Malaysia | Asset Owner |
| Sanlam Life Insurance | South Africa | Asset Owner |
| Skandia Administradora de Fondos de Pensiones y Cesantías | Colombia | Asset Owner |
| The Consolidated Retirement Fund for Local Government | South Africa | Asset Owner |
| Unión Capital AFAP | Uruguay | Asset Owner |
| Valia | Brazil | Asset Owner |
| Vivest | Brazil | Asset Owner |
| Vivir Seguros | Peru | Asset Owner |
Expenditure
Between 1 April 20120 and 31 March 2021, total expenditure excluding PRI in Person grew to £18.5 million, up from £16.1 million in 2019/20.
| Actual 2019/20 | Actual 2020/21 | Budget 2021/22 | |
|---|---|---|---|
| Staff costs (incl networks, recruitment, training & development) | 9,501 | 11,093 | 15,718 |
| Bought-in services, consulting and research** | 2,773 | 3,984 | 4,109 |
| Travel expenses | 941 | 12 | 159 |
| Premises costs | 654 | 1,033 | 1,050 |
| IT costs and telephone | 1,054 | 1,022 | 1,600 |
| Events, meetings, conferences & hospitality | 352 | 189 | 572 |
| Legal & professional services | 252 | 257 | 221 |
| Subscriptions, reports & printing | 166 | 149 | 171 |
| Academy commissions & marketing | 7 | 9 | 9 |
| Contribution to UNEP FI | 200 | 110 | 111 |
| Other expenditure (Insurance, postage, office supplies, bank charges) | 219 | 668 | 286 |
| Total (PRI in Person expenditure not included) | 16,119 | 18,525 | 24,007 |
**Significant bought-in services, consulting and research include: AECOM (SDG in Infrastructure), Sustainability in Finance (SDG Flagship report), Clean Return (IPR programme), Contrast Capital (Reporting Framework Indicators), London School of Economics (TPI), Freshfields (EU Sustainable Finance Action plan), Globalbalance Ltd (Biodiversity project), Mantle 314 Inc (LP Guidance Revision), Smart Cube (ESG Structures Credit report).
Expenditure by area
| Actual 2019/20 | Actual 2020/21 | Budget 2021/22 | |
|---|---|---|---|
| Management and Operations | 3,531 | 3,905 | 5,111 |
| Global Outreach and Networks | 3,059 | 3,168 | 4,017 |
| Communications & Events | 1,457 | 1,793 | 2,419 |
| Content teams | 3,402 | 3,099 | 5,115 |
| Reporting and Assessment | 1,065 | 1,624 | 1,533 |
| Premises costs | 654 | 1,033 | 1,050 |
| Grants, other | 1,761 | 2,579 | 2,394 |
| UN Asset Owner Alliance | 191 | 890 | |
| PRI Academy | 389 | 458 | 738 |
| Partnerships | 184 | 142 | 190 |
| Consulting and research | 616 | 533 | 550 |
| Total | 16,119 | 18,525 | 24,007 |
Number of staff by department
| March 2020 | March 2021 | Forecast March 2022 | |
|---|---|---|---|
| Content team | 54 | 65 | 83 |
| Reporting and Assessment | 11 | 14 | 16 |
| Global outreach and networks | 32 | 33 | 45 |
| Management and Operations | 25 | 26 | 35 |
| PRI Academy | 2 | 5 | 6 |
| Communications and Events | 15 | 18 | 26 |
| Total | 139 | 161 | 210 |
Cash reserves
Cash increased to £11.8 million at the end of the year, up from £8 million at the end of 2019/20. This included receiving restricted funds (£1.9 million) and sponsorship fees from PRI Tokyo (£1.6 million). Our reserve policy is to have enough cash on hand to cover three months of core expenditure.
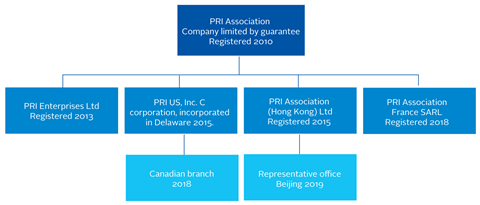
Corporate structure
The PRI group comprises seven entities, with PRI Association being the ultimate holding company. Signatory fees are collected by PRI Association and disbursed across the group. Entities are established where there is a specific operating or regulatory requirement.
PRI Enterprises is the home of the PRI Academy and is primarily funded by course fees.
Operating surplus
After taking into account interest receivable, depreciation and tax, we achieved a surplus of £2.6 million, up from £1.8 million for 2019/20.
References
[1] 2020/21 figures are draft
[2] See IMF’s World Economic Outlook 2016 (Statistical Appendix, p.209) for a full list of eligible countries.