

Case study by Ortec Finance
- Signatory type: Service provider
- Region of operation: Global
Ortec Finance specialises in quantitative modelling of systemic climate-related risks and opportunities for use in strategic asset allocation and asset-liability management. We deliver quantified climate risk informed economic and financial scenarios.
Why investors need to model the role of extreme weather events on asset class risk and opportunities
Climate scenario models looking at gradual physical risks such as sea level rise and temperature effects on worker and agricultural productivity are already well advanced. However, the modelling of the role of extreme weather events is still rather underdeveloped.
To overcome this current gap, we apply our in-house ClimatePREDICT model, developed by Predict Ability Ltd (PAL). This forecasts the increase in frequency as well as the financial impact of climate-related extreme weather risk to physical assets and economic growth, year by year and across peril classes for over 120 countries worldwide.
By including the expected impacts of climate-attributable extreme weather events as part of the total physical risks, we enable investors to gain a full picture of the climate-related risks and opportunities they should be considering when thinking through their strategic asset allocation. The case study below, illustrates in more detail why extreme weather risk is an important angle to consider from both the investment as well as the liabilities perspective.
How we model the future expected financial impact of climate-change related extreme weather events
We model two broad future climate scenarios: either the world continues on our current path (Failed Transition) or we transition to a low-carbon economy (Paris Transition).
Our ClimatePREDICT model uses a statistical algorithm to identify at risk locations and total number of loss events per year based on hazard loss data. ClimatePREDICT enables the quantification of climate-related extreme weather risk across different climate scenarios by combining this with climate attribution factors, urbanisation trends and hazard risk scores per type of peril.
Figure 1 – ClimatePREDICT (climate change-related) extreme weather risk and impact model
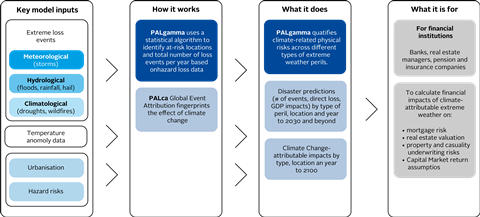
With over 1800 individually calibrated cities in its database, ClimatePREDICT is used to assess the specific risk profiles of individual cities e.g. the unmitigated flood losses of London when considering the rationale for a second Thames Barrier.
Disaggregated insights into the individual physical climate risk drivers, help improve investment decision-making such as assessing risks to real assets, real estate and mortgage portfolios, or enhancing insurance companies’ in-house P&C catastrophe models.
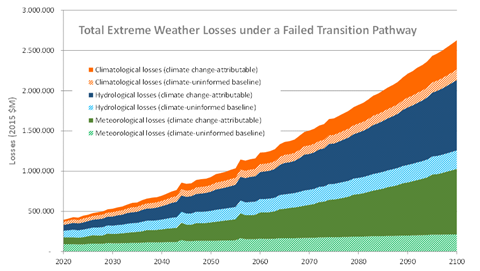
To this end, the ClimatePREDICT model identifies the growing extent by which climate change is amplifying extreme weather losses under a range of climate scenarios. The figure below illustrates how globally total extreme weather losses under a Failed Transition pathway can be split into expected trends under a climate-uninformed baseline (i.e. expected losses per type of peril) and a proportion that is attributable to the specific climate scenario (in this case a Failed Transition) the world would find itself in.
Under this scenario, whilst the frequency of extreme weather events is expected to triple between now and 2100, overall direct losses are expected to increase sixfold (in 2015 US$ terms).
Figure 2 – All perils picture: water related events dominate but droughts grow strongly
Example: analysing extreme weather losses under different climate scenarios – the case of New York City, USA
To illustrate the application of the model, let us consider meteorological (storm) events. The diagram below shows, year by year, the prediction of the number of storm events worldwide. The likely trend in event-related losses under four climate scenarios ranges from ‘no climate change’ (blue line) to a ‘Failed Transition scenario’ (orange zone) where global temperatures are expected to increase to around 4°C by 2100.
Figure 3 – Simplified diagram showing the global picture for future expected meteorological (storm) events under different climate scenarios
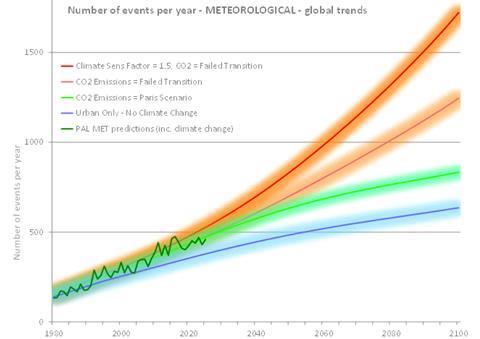
As shown in Figure 3, if the world fails to transition to a low-carbon economy (orange zone), the event frequency of storm events globally increases sharply from around 500/year today to twice that by 2050. Only under the Paris/1.5°C pathway (green line) does the expected frequency of storm events and associated losses start to level out by the century’s end.
When zooming in to an illustrative case on city level insights, the table illustrates the quantified scenario analysis results for a selected city, in this case New York-Newark Metropolitan Area, and selected peril type, in this case hydrological (flooding).
| NY - Meteorological events | 2020 $bn | 2030 $bn | 2050 $bn | 30 year increase | |
|---|---|---|---|---|---|
| NY | PARIS Transition | 1.0 | 1.2 | 1.6 | 63% |
| NY | FAILED Transition | 1.0 | 1.3 | 2.0 | 108% |
| NY | NO-CC (only other hazard risk drivers such as urbanisation) |
1.0 | 0.7 | 0.8 | 33% |
The table describes the expected financial impacts stemming from flood risk across the four climate scenarios over time. In 2020, with ca. 1°C of warming, climate change is already amplifying New York’s flood losses by approximately US$ 0.4 billion, but that number is expected to increase starkly especially under a Failed Transition scenario, where climate-attributable flood losses are expected to more than double by 2050 compared to a climate-uninformed baseline.
Figure 4 – New York versus London: Expected future flood losses under different climate scenarios
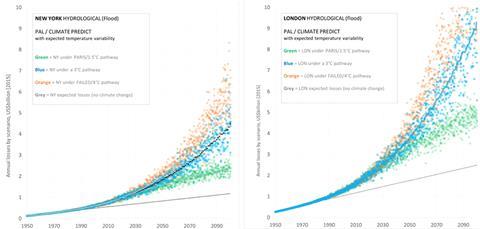
Under a Failed Transition (orange), New York’s flood losses are expected to increase sixfold by 2100, whereas in London the increase in flood losses compared to today’s figures is slightly less pronounced (losses quadruple). Total expected flood loss US$ amounts, however, are significantly higher in London (<US$10bn) than in New York (~US$ 6bn). As the world warms, the ClimatePREDICT model indicates that climate variability will increase.
The upward veering trend under this scenario could therefore be even intensified, if climate tipping points increase the Earths’ sensitivity to each tonne of CO2 – that is the TCRE or transient climate response to cumulative CO2.
When comparing the two cities under a Paris Transition scenario, on the other hand, we observe that both will see their flood losses slightly more than double by end of century and thus curbing flood losses to around US$ 2-3bn and US$ 4-5bn respectively.
The findings presented in this case study first of all illustrate that investors should consider the geographical location and implied climate-related extreme weather exposure when determining the allocations to real estate, infrastructure, or any other physical assets in their strategic asset allocation process. Secondly, investors should incorporate the impact from all climate-change related physical risks (both gradual risks and extreme weather risks) on the total economy and all asset class expected risks and return.