
By Harrison Hong and Neng Wang, Columbia University; and Jinqiang Yang, Shanghai University of Finance
As part of the Glasgow Financial Alliance for Net Zero, 450 major financial firms from across 45 countries have pledged nearly US$130 trillion to restrict investments to sustainable corporations that have decarbonisation plans.
These pledges, which account for nearly 20% of global capital stock, are meant to incentivise value-maximising corporations to decarbonise, by rewarding sustainable firms with higher stock prices and penalising unsustainable firms with a lower stock price.
Considering the failure of legislatures to pass comprehensive carbon taxes, they are one of the few bright spots in terms of global efforts to address the climate change externality.
To avert the worst consequences of global warming, such as a climate tipping point resulting in more frequent weather disasters, global decarbonisation capital stock needs to build up significantly.
Decarbonisation measures, which include plants for direct air capture or bioenergy with carbon capture and storage, and afforestation or reforestation,[1] yield no productive output. Their only purpose is to reduce the concentration of carbon emissions in the atmosphere.
But how should these net-zero pledges be implemented to maximise the expected utility for households – the shareholders of corporations and ultimate owners of capital? That is, how quickly should the corporate sector optimally decarbonise, given the trade-offs between the costs of accumulating decarbonisation capital versus the benefits of averting a climate tipping point?
How much decarbonisation spending do firms need, to be labelled as sustainable and to qualify for inclusion in restricted, net-zero compliant portfolios? And what would the cost to shareholders be in terms of expected returns?
How best to implement net-zero pledges?
Our paper, Welfare Consequences of Sustainable Finance, examines how best to implement net-zero pledges by developing a model where more decarbonisation relative to productive capital results in less cumulative emissions, and thus delays a climate tipping point.[2]
For a given fraction of wealth that is pledged to investing only in sustainable firms, we solve for the optimal mandate – a decarbonisation spending threshold required for inclusion in restricted portfolios that maximises the expected utility for households. Stocks in these portfolios are not allowed to be lent for shorting. We assume that carbon removal measures are effective regardless of the firm, be it a technology company or an oil and gas producer, that implements them.
The model allows us to generate an optimal decarbonisation path that can be used to assess the corporate sector’s net-zero transition progress and to calculate the cost to shareholders, by considering:
- realistic risk preferences
- adjustment costs to productive and decarbonisation capital;
- the likelihood of a climate tipping point
- projected damages to economic growth absent mitigation.
Decarbonisation to productive capital and the net-zero transition
For our quantitative analysis, we consider a risky scenario where a climate tipping point is expected in the next 10 years absent decarbonisation. Figure 1 plots the ratio of decarbonisation-to-productive capital stock against time.
Due to adjustment costs, this ratio rises gradually, before reaching a steady state in 2050 at 4.76%. Since the current productive capital stock is estimated to be around US$600 trillion, the decarbonisation capital stock will have to reach nearly US$27 trillion by 2050, i.e., the decarbonisation sector will be arguably the largest in the global economy.
Under our optimal net-zero transition, much of this increase in decarbonisation capital stock will have to occur over the next 15 years. Paris Treaty goals of reaching net-zero by 2050 are too slow relative to our optimal mandate.
Even lower-risk scenarios, such as a climate tipping point expected in the next 20 to 30 years, would require a rapid build-up of decarbonisation capital because a tipping point is irreversible and damaging.
Figure 1: Transition of the decarbonisation-to-productive capital stock ratio

Mandated firm decarbonisation spending and cost to shareholders
To maintain this steady-state ratio, where decarbonisation stock stays in line with productive capital, annual aggregate decarbonisation spending needs to represent around 0.24% of productive capital stock – roughly US$1.44 trillion. This is needed as investments in productive capital will continue.
Of course, how much sustainable firms need to spend on decarbonisation depends on what fraction of firms or wealth have made net-zero pledges.
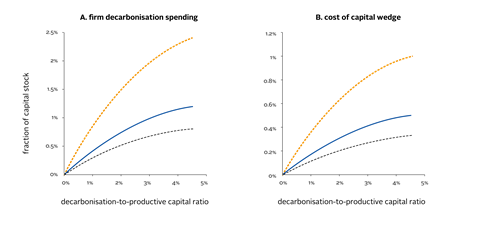
Figure 2 Panel A plots the mandated qualification thresholds for three levels of wealth pledged to net zero against the level of decarbonisation-to-productive capital stock in the economy (x-axis).
The values of the x-axis run from 0% to 4.5% – the steady-state level of decarbonisation-to-productive capital. The blue solid line of 20% is roughly what has been pledged to the Glasgow Financial Alliance.
At 20% of wealth restricted, the steady-state annual contribution is 1% of firm capital stock. If only 10% of wealth (the red line) is restricted, sustainable firm spending will have to be higher in steady state (at 2.5%), while if 30% of wealth is restricted (the dashed grey line), then the spending threshold is lower, at only 0.5% of firm capital stock.
Regardless of the scenario, optimal firm spending thresholds rise with the decarbonisation-to-productive capital stock ratio – due to adjustment costs, the optimal qualification standards become more stringent overtime.
Figure 2: Required firm decarbonisation spending as a fraction of capital and the cost of capital wedge[3] for different levels of capital stock
Although sustainable firms have lower cashflows to pay out due to mitigation spending, they also have lower costs of capital (the expected returns required by the net-zero pledge investors). The cash-flow effect and the discount-rate effect exactly offset each other, leaving all firms indifferent between being sustainable and unsustainable. That is, on balance, the costs of these decarbonisation investments are borne by the shareholders that make net-zero pledges.
Sustainable firms’ lower capital costs subsidise their decarbonisation, which they would have otherwise distributed as shareholder dividends. The benefits of this decarbonisation accrue to the entire economy.
The cost of capital wedge between sustainable and non-sustainable firms is captured in Figure 2 Panel B.
For the blue line at 20% wealth restricted, the cost-of-capital wedge between sustainable and unsustainable firms is 0.5% per annum at the steady state. This rises over time, since the qualification threshold for being a sustainable firm is becoming more stringent.
When less wealth is restricted, the cost of capital wedge is higher, since a smaller fraction of firms must bear more of the decarbonisation burden for society. When more wealth is restricted, the cost of capital wedge is lower since these costs are spread across more firms.
Conclusion
Considering the failure of society to implement carbon emissions taxes, net-zero pledges are one of the few bright spots in terms of global efforts to combat global warming.
But just how to implement these pledges remains elusive. We propose an optimal implementation that maximises the expected utility for households as a way forward for these net-zero pledges.
We also show that our optimal implementation of net-zero pledges can solve the global warming externality as effectively as optimal carbon emissions taxes.
It only requires firm decarbonisation spending annually and a measure of aggregate decarbonisation capital stock – both are realistically obtainable as part of disclosure regulations within the year.
For more on how investors are approaching net-zero and climate risk, see the PRI’s investor resource guide here.
This paper was presented at the PRI Academic Network Week 2021.
This blog is written by PRI staff members and guest contributors. Our goal is to contribute to the broader debate around topical issues and to help showcase some of our research and other work that we undertake in support of our signatories. Please note that although you can expect to find some posts here that broadly accord with the PRI’s official views, the blog authors write in their individual capacity and there is no “house view”. Nor do the views and opinions expressed on this blog constitute financial or other professional advice.If you have any questions, please contact us at [email protected].
References
[1] Intergovernmental Panel on Climate Change (2018) Mitigation pathways compatible with 1.5˚c in the context of sustainable development.
[2] An absorbing state characterised by more frequent and economically destructive weather disasters such as heatwaves, droughts, hurricanes, and wildfires. See National Academies Press (2016) Attribution of extreme weather events in the context of climate change for more detail.
[3] Defined as unsustainable firms’ cost of capital minus sustainable firms’ cost of capital.