Danica Pension
Signatory type: Asset owner
HQ location: Denmark
AUM: DKK 450 billion
COVERED IN THIS CASE STUDY
Asset classes: Public equity, corporate bonds, real estate
Danica Pension (Danica) is one of the largest commercial pension funds in Denmark. As a wholly owned subsidiary of the Danske Bank Group, Danica has about 800,000 customers in Denmark. We specialise in pension schemes, life insurance policies and health insurance covers, and we have total pension funds of DKK 450 billion with annual contributions of DKK 37 billion.
Why we set sectoral decarbonisation targets
We referred to the Net-Zero Asset Owner Alliance (NZAOA) Target Setting Protocol when setting decarbonisation targets, prompting a discussion around sub-portfolio vs. sector targets. We chose to focus on sector targets because we believe that this approach, by considering the industry dynamics of the entire energy system, forms the most credible and feasible basis for driving positive outcomes in the real economy. Furthermore, sector targets anchor naturally with engagement efforts. And while sector targets are more complicated to understand and manage than a sub-portfolio approach, they are easier to translate into an investment strategy across the various portfolios and asset classes with less tracking error.
How we set sectoral decarbonisation targets
Danica joined the NZAOA in 2020, and in the same year committed to becoming carbon neutral by 2050. We are one of the first asset owners to have set intensity-based sectoral decarbonisation targets.
We wanted to utilise the most up-to-date scientific knowledge on sectoral decarbonisation when setting targets, but in a pragmatic and operationally feasible way. This is why we leveraged the One Earth Climate Model (OECM) as a theoretical foundation, supplemented by robust, disclosure-based assessments done by the Transition Pathway Initiative (TPI) that utilise Sectoral Decarbonisation Pathways. When we developed sectoral targets, the OECM considered only Scope 1 and 2 GHG emissions. TPI assessments, however, factored in relevant emissions within each included sector, thereby considering Scope 3 emissions for some sectors. Furthermore, TPI data had a relatively good coverage of the allocated emissions of our portfolio investments. Our targets cover priority sectors set by the NZAOA, including energy, utilities, materials, transport and steel. We added the cement sector due to its material emissions contribution to the portfolio. We identified the material and relevant emissions scopes by each of the sectors and set targets accordingly. The detailed sectoral targets can be found in Figure 1.
Figure 1. Danica’s sector targets
| Sector | 2025 intensity reduction target |
|---|---|
|
Energy |
-15% |
|
Utilities |
-35% |
|
Transport – airlines |
-15% |
|
Transport – shipping |
-20% |
|
Transport – automobiles |
-30% |
|
Transport – trucking |
-25% |
|
Steel |
-20% |
|
Cement |
-20% |
In addition, we have committed to reducing the CO2 intensity in the Danish real estate portfolio by 30% by 2023, 37% by 2025 and 69% by 2030, relative to the 2019 level.
The sector target-setting process involved several steps:
- Mapping our existing portfolio holdings in the identified high emitting sectors and calculating an emissions baseline for each sector using TPI methodology.
- Identifying the companies that contributed to 80% of the sectoral emissions and evaluating their intensity against required 2025 intensity level based on OECM.
- Assessing each sector, comparing sectoral baseline and required targets by OECM as well as TPI benchmarks (that utilised IEA energy system modelling with relevant scopes of emissions), noting that OECM and TPI (IEA) pathways differ somewhat for certain sectors.
- Setting sector targets that have a good balance of scientific robustness and are realistic to achieve, given they are applied to investment strategies and considering that in aggregate our sectoral targets would contribute to system-level decarbonisation aligned with the latest climate science.
Tracking and implementing targets
Since setting the sectoral targets, we have been conducting quarterly progress reviews to track portfolio decarbonisation progress. Using climate data from multiple vendors, we identify top emitters that contribute to over 80% of the emissions in each sector and analyse how these companies’ emissions are aligned or misaligned with our short- (shown in Figure 1 above), medium- and long-term targets. We also review companies’ decarbonisation strategies, climate governance and other factors that allow us to identify gaps that we can address via engagement.
The analysis supports our value-adding engagement dialogues with companies about climate-related risks and opportunities. Such dialogues enable us to make direct comparisons between the climate impacts of different companies, and we can provide better input to support the companies’ work with climate-related issues, thereby supporting their long-term growth opportunities in a responsible way. We recognise that improvements may take time.
We also emphasise that companies should improve their reporting on climate-related risks and opportunities in accordance with Task Force on Climate-Related Financial Disclosures (TCFD) recommendations. Our net-zero commitment as well as our views on companies’ decarbonisation progress are also reflected in proxy voting.
If we conclude that a company is not sufficiently improving over time, and if we see no further means of exerting pressure on company management, we may choose to exclude that specific company and put it on our exclusions list, which we share on our website.
Another pillar of our net-zero commitment is increasing investment in the green transition – to DKK 50 billion by 2023 and DKK 100 billion by 2030, from DKK 33.5 billion invested as of 30 June 2022. For example, we invested in the US offshore wind farm Vineyard Wind I and Scottish offshore wind farm Beatrice, the fourth-largest in the world. Those projects produce enough green electricity to meet the annual energy consumption of 400,000 and 450,000 households, respectively.
We publish an annual active ownership report and TCFD report and disclose our portfolio carbon footprint as well as green transition progress.
Example: How we set targets in the utilities sector
Using the utilities sector as an example, OECM at the time (2020) required sectoral Scope 1 emissions to decrease 37% and Scope 2 to decrease 24% by 2025, while emissions intensity of electricity generation should decrease 43% (to 0.276 tn CO2e / MWh) by 2025. The IEA’s below 2°C scenario, as used by TPI, was somewhat more moderate, requiring emissions intensity from electricity generation to decrease 24% by 2025 (to 0.333 tn CO2e / MWh), while its 1.5°C scenario requires 34% intensity reduction (to 0.288 tn CO2e / MWh).
Figure 2: Utilities sector target – Danica vs TPI vs OECM
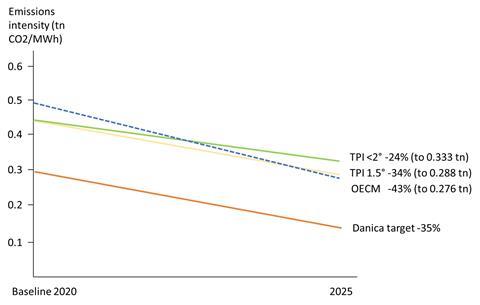
Using TPI data, the baseline for our utilities holdings was estimated at 0.293 tn CO2e / MWh, hence already close to 1.5°C scenario levels. In terms of the NZAOA Target Setting Protocol, there was an option to set a 2025 target using either a point-in-time target intensity or a percentage reduction in emissions intensity. Given that the emissions level for portfolio utilities holdings was already very low, it would not be ambitious to set targets equal to OECM or TPI’s 2025 point-in-time sectoral intensity. In order to show commitment to decarbonise further while being mindful of the feasibility of the sector to reach this level of ambition, we chose our own 35% reduction target, which falls between TPI’s 34% intensity reduction target and OECM’s 43% decline.
Find out how other investment managers and asset owners implemented net-zero commitments in listed equity portfolios in our report, Net zero in practice: Insights from equity investors.