
| ORGANISATION DETAILS | |
|---|---|
| Name | Morgan Stanley Investment Management |
| Signatory type | Investment manager |
| Region of operation | Global |
| Assets under management | USD$665bn (as of 30/06/20) |
| COVERED IN THIS CASE STUDY | |
|---|---|
| Asset class | Equities, Green Bonds through ETF implementation |
| Geography | Global |
| Environmental activity | Mitigation |
| Economic activity | All |
As the number of signatories to the Principles for Responsible Investment (PRI) rises, and ESG-integrated assets under management (AUM) across the world reach over $30 trillion, carbon emissions and global temperatures also continue to rise. Despite industry efforts around sustainable investing, we are yet to see real economy outcomes, the most important and pressing being climate change action.
We welcome the fact that the taxonomy helps companies and investors identify investable activities that are best positioned to move the needle on global warming. We are committed to learning from, and aligning with, the regulation over time, and engaging with our portfolio companies and data providers to encourage disclosures that allow us to allocate capital to taxonomy-aligned companies.
Other aspect you would like to mention?
This case study is based on an illustrative multi-asset portfolio that pursues a range of sustainable investing strategies (ESG integration, restriction screening, engagement and impact). The illustrative portfolio is allocated as 40.5% ESG-tilted equity baskets, 43.5% fixed income, 6.5% cash, 6.5% impact equities (managed by external managers) and 3% green bonds (offered through a third party green bond ETF).
The portfolio also conducts annual thematic engagements with companies on material ESG issues.
The case study assessment only focuses on the ESG-tilted equity baskets and green bond portion of the portfolio, due to data availability and resource constraints.
Taxonomy implementation
Principles, criteria, thresholds
For ESG-tilted equity baskets, we used the Bloomberg EU taxonomy watchlist function to map eligible equity by revenue breakdown. Then, we used MSCI ESG data to verify technical screening criteria and aligned revenues.
The exposure to green bonds is obtained through an Exchange Traded Fund (ETF) that invests in green bonds defined as eligible for index inclusion by the Climate Bonds Initiative. All bonds certified by this initiative are taxonomy-aligned.
Do no significant harm assessment
We excluded from the investable universe all stocks with an MSCI Controversy red flag. This was the most feasible implementation approach given the large number of securities in the portfolio. This is a proxy metric that can be substituted with other data streams in the future. The illustrative portfolio incorporates companies’ ESG ratings and climate scores when constructing equity baskets for asset allocation. This additional overlay helps the portfolio identify companies with significant harmful activities, in addition to the use of exclusions.
Social safeguards assessment
We used MSCI controversy screens to confirm minimum social safeguards were met.
Turnover/capex/opex alignment
We used MSCI sustainable revenue metrics for turnover. These are often imperfect substitutes and do not map one-to-one against mitigation criteria.
Addtional comments
While we looked for OPEX/CAPEX-aligned metrics among our ESG data provider set, we could not find sufficient metrics to map against the taxonomy’s adaptation criteria.
Alignment results
Taking only our ESG-tilted Equity and Green Bonds exposure, the taxonomy eligibility of that portion of the multi-asset portfolio was 19.66%, of which 32.05% was taxonomy-aligned. Hence, the overall taxonomy alignment of the ESG-tilted Equity Baskets and Green Bonds exposure stood at 6.30%.
We did not assess the portfolio’s impact allocation, as this is externally managed, but we interviewed third party managers on their current approaches to taxonomy alignment. While all managers were aware of the taxonomy, they were in the early days of implementation and unable to provide estimates of their portfolios’ alignment. We also did not assess alignment across our fixed income allocation due to data constraints, particularly lack of capex/opex data, which also hindered our ability to assess adaptation criteria.
To apply the taxonomy to fixed income, we believe there needs to be greater data disclosure from end issuers on use of proceeds for any bond, not just “green” or “sustainable” bonds. Therefore, we recommend the EC develop transition taxonomies to help classify activities that are not purely green. This would broaden what can be reported as aligned for a multi-asset portfolio with numerous holdings.
As described above, the metric mapping between taxonomy criteria and ESG data providers does not represent a 100% match. Rather the taxonomy alignment figures represent a “best effort” approach.
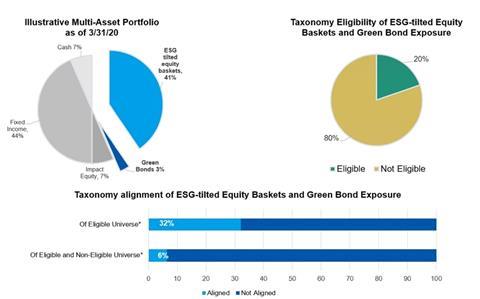
* Universe refers only to ESG-tilted equity and green bond portions of the portfolio
Note: alignment data assessed on best efforts basis using available tools and data results are not final or complete
Challenges and solutions
| NO. | CHALLENGE | SOLUTION |
|---|---|---|
| 1 | Technical screening criteria for some sectors required carbon intensity per unit produced, while carbon intensity data provided by data providers was expressed as carbon per million dollars in revenue. | We assessed the portion of the taxonomy eligible universe that came under screening criteria where carbon intensity data was required. As the proportion was very small, we decided not to include it in the assessment for taxonomy alignment. |
| 2 | There was a lack of company reporting on revenue and DNSH criteria, as well as relevant metrics by ESG data providers. |
For Do No Significant Harm (DNSH), the MSCI “Red” flag companies were eliminated to set a minimum standard. Still, this is a long way from capturing the taxonomy’s full DNSH criteria. |
| 3 | The ’adaptation’ of the taxonomy assessment was particularly challenging because ESG data providers do not usually have metrics on CAPEX and OPEX disclosures. | We omitted CAPEX/OPEX-related data for the time being. |
Recommendations
We see a significant opportunity for issuers, data providers and investors. Issuers can make taxonomy-aligned reporting more readily available and increase their eligibility/alignment for sustainable and impact-focused investors. Data providers have an opportunity to create off-the-shelf data mapping solutions to assist managers in assessing their portfolio’s alignment. Lastly, there is a significant opportunity for investors to engage with issuers to encourage enhanced disclosures and to use the taxonomy framework as a guide for encouraging sustainable business activities.
One concern we have around the Taxonomy, and a consideration for the European Commission, is that if the methodology is going to be reliant on company revenues to determine alignment, then strategies that focus on the large listed space will continue to have a low level of overall alignment if reported on a percentage basis of overall revenues, as compared to what is possible among small cap or private equity companies.
The views and opinions are those of the author as of the date of preparation of this material and are subject to change at any time due to market or economic conditions and may not necessarily come to pass. Furthermore, the views will not be updated or otherwise revised to reflect information that subsequently becomes available or circumstances existing, or changes occurring, after the date of publication. The views expressed do not reflect the opinions of all investment teams at Morgan Stanley Investment Management or the views of the firm as a whole, and may not be reflected in all the strategies and products that the Firm offers. Forecasts/estimates are based on current market conditions, subject to change, and may not necessarily come to pass.The information provided has been prepared solely for informational purposes and does not constitute an offer or a recommendation to buy or sell any particular security or to adopt any specific investment strategy.