

Gilbert E. Metcalf, Department of Economics at Tufts University, and the National Bureau of Economic Research; James H. Stock, Department of Economics at Harvard University, and the National Bureau of Economic Research
Economists widely agree that putting a price on carbon emissions, whether through a cap-and-trade program or a tax, is a key element of a set of economically efficient policies to reduce greenhouse gas emissions. There are numerous bills to establish national carbon tax systems and a few cap-and-trade bills making their way through the current US Congress, which reflect a growing consensus that national action is needed to curb our carbon pollution and that a carbon tax is the most straightforward way to do that. They also echo a broader consensus, with more than 3,500 economists signing the Climate Leadership Council’s statement calling for a carbon tax as “the most cost-effective lever to reduce carbon emissions at the scale and speed that is necessary.”
A major stumbling block to pricing carbon pollution is concern about the economic impact of the policy. The Trump administration’s retreat from a climate policy is a case in point. In starting the withdrawal process from the global Paris Agreement, the US President claimed that the cost to the economy would be “close to US$3 trillion in lost GDP and 6.5 million industrial jobs…”
However, our recent paper highlights that these dire consequences are simply not supported by the data. We find no evidence that carbon taxes have adverse effects on GDP growth or total employment. They do, however, reduce emissions. The results in our analysis are consistent with a growing body of evidence on the economic growth and emissions impacts of carbon taxes.
How should we assess the economic costs of a carbon tax? Until recently, most analyses were based on the results of large-scale economic models. But we now have enough experience with carbon tax systems around the world to carry out statistical analyses, with up to three decades of data to draw on.
We carry out an analysis of the 31 countries in Europe that are part of the EU-wide emissions trading system (EU-ETS). While all these countries price a portion of their emissions through this cap-and-trade system, fifteen of them also impose a carbon tax, mostly on emissions not covered by the EU-ETS. By limiting our analysis to countries within the EU-ETS and comparing their differing carbon tax systems, we can identify the incremental impact of carbon taxes on emissions, output, and employment.
Carbon taxes in Europe
Carbon taxes were first enacted in Europe in 1990, with Finland leading an early wave of primarily Nordic countries in doing so. To date, sixteen European countries have carbon taxes in place (see Table 1). We focus on countries that are also part of the EU-ETS, to control for the impact of the ETS on growth, and so exclude Ukraine from our analysis.
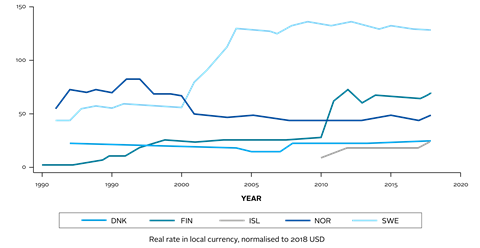
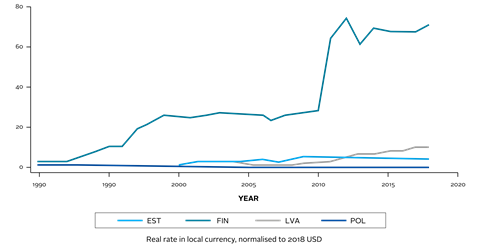
Table 1 summarises information about carbon taxes across these countries and demonstrates the range of tax rates, enactment dates, and emissions shares covered by the tax. Figure 1 shows the time trend of carbon tax rates in these countries. (Note that the scale in the vertical axis for the top panel of Figure 1 is different from the scale in the other two panels given Sweden’s high tax rate.)
What we found
We simulate a US$40-per-ton increase in a carbon tax that covers 30% of emissions in a country (roughly the average across the countries in our sample). Figure 2 depicts the immediate impact (solid red line) and the impact going out six years of the tax change on GDP growth rates, based on our analysis. The graph indicates that the GDP growth rate rises to roughly one-half a percentage point by year three, declines and hovers a bit above zero by year six. The two coloured bands around the line indicate 67% and 95% confidence bands. At the given level of confidence, any impact contained within the band is reasonable. Since the bands include zero, a zero impact on economic growth can’t be ruled out. We can, however, reject large negative growth impacts of the tax. Our results hold more generally – we find no evidence of adverse effects on GDP growth or total employment.
We also find that long-term growth rates of GDP and employment are unaffected by the tax. This latter finding is consistent with macroeconomic theory, which suggests that long-term growth rates are driven by fundamentals such as technological progress, which in turn are unaffected by changes in relative prices. Our results also are consistent with most general economic models for climate policy.
Finally, we find cumulative emissions reduce by 4% to 6% for a tax of US$40-per-ton of CO2 covering 30% of emissions (see Figure 3). We argue that this reduction is likely to be lower than what we would expect for a broad-based carbon tax in the United States, because European carbon taxes do not include in their tax base the power sector, which has the lowest marginal cost of carbon pollution abatement. (In Europe, power sector carbon emissions are priced under the EU-ETS.)
The takeaway
Placing a price on carbon pollution will be key to reducing our greenhouse gas emissions cost effectively. Resistance to this approach is significant in part due to concerns about the economic impact on jobs and growth. Our analysis of carbon tax systems in European countries that are part of the EU-ETS shows no evidence to support claims that carbon taxes are job killers or that such taxes prevent GDP growth. Our research also shows that carbon taxes correlate with notable emissions reductions across Europe, highlighting the potential efficacy of carbon taxes elsewhere.
Table 1. EU + Carbon Taxes
|
Country |
Year of Enactment |
Rate in 2018 (USD per metric ton) |
Intended Revenue Recycling*? |
Share of Greenhouse Gas Emissions in 2019 Covered by Tax |
Carbon Tax Revenue in 2018 (USD Millions) |
|
Denmark (DNK) |
1992 |
24.92 |
Yes |
40% |
543.4 |
|
Estonia (EST) |
2000 |
3.65 |
No |
3% |
2.8 |
|
Finland (FIN) |
1990 |
70.65 |
Yes |
36% |
1,458.6 |
|
France (FRA) |
2014 |
57.57 |
No |
35% |
9,263.0 |
|
Iceland (ISL) |
2010 |
25.88 |
No |
29% |
44.0 |
|
Ireland (IRL) |
2010 |
24.92 |
No |
49% |
488.8 |
|
Latvia (LVA) |
2004 |
9.01 |
No |
15% |
9.1 |
|
Norway (NOR) |
1991 |
49.30 |
Yes |
62% |
1,659.8 |
|
Poland (POL) |
1990 |
0.16 |
No |
4% |
1.2 |
|
Portugal (PRT) |
2015 |
11.54 |
Yes |
29% |
154.9 |
|
Slovenia (SVN) |
1996 |
29.74 |
No |
24% |
83.1 |
|
Spain (ESP) |
2014 |
30.87 |
No |
3% |
123.6 |
|
Sweden (SWE) |
1991 |
128.91 |
Yes |
40% |
2,572.3 |
|
Switzerland (CHE) |
2008 |
80.70 |
Yes |
33% |
1,177.7 |
|
UK (GBR) |
2013 |
25.71 |
No |
23% |
1,091.0 |
Source: World Bank Group (2019a) * Revenue Recycling: income generated from carbon taxes is earmarked and returned to citizens


This blog is written by academic guest contributors. Our goal is to contribute to the broader debate around topical issues and to help showcase research in support of our signatories and the wider community.
Please note that although you can expect to find some posts here that broadly accord with the PRI’s official views, the blog authors write in their individual capacity and there is no “house view”. Nor do the views and opinions expressed on this blog constitute financial or other professional advice.
If you have any questions, please contact us at [email protected].