Appendix 1: Tools across the five-part framework
Examples of free to use, globally applicable tools that may be relevant for identifying outcomes, and/or setting and tracking progress against outcome objectives. (Relevant tools at the national and sub-national level have not been included here.)
| Tool | Lead organisation(s) | Primary audience (investors/corporates) | Contains outcome metrics | Includes assessment of specific companies | References regional or global norms or thresholds |
|---|---|---|---|---|---|
|
B-Lab |
Corporates |
Yes |
Yes |
No |
|
|
UNGC |
Corporates |
No |
No |
No |
|
|
CDSB Framework for environmental and climate change reporting |
Climate Disclosure Standards Board (CDSB) |
Corporates |
Yes |
No |
No |
|
Climate Bonds Initiative |
Both |
Yes |
No |
Yes |
|
|
Corporate Human Rights Benchmark Ltd. |
Investors |
No |
Yes |
Yes |
|
|
European Union |
Investors |
Yes |
No |
Yes |
|
|
Future-Fit |
Corporates |
Yes |
No |
Yes |
|
|
Going Beyond Impact Measurement to Assess the Effectiveness of System-level and SDG Investing |
The Investment Integration Project (TIIP) |
Investors |
No |
No |
No |
|
GRESB |
Both |
Yes |
No |
No |
|
|
Global Reporting Initiative (GRI) |
Both |
Yes |
No |
No |
|
|
Collaboration of Development Finance Institutions |
Investors |
Yes |
No |
No |
|
|
PRI |
Investors |
Yes |
No |
Yes |
|
|
Impact Management Project |
Both |
No |
No |
No |
|
|
University of Cambridge Institute for Sustainability Leadership |
Investors |
No |
No |
No |
|
|
Global Impact Investing Network (GIIN) |
Investors |
Yes |
No |
No |
|
|
UNEP-FI |
Both |
Yes |
No |
No |
|
|
Sustainability Accounting Standards Board (SASB) |
Investors |
Yes |
No |
No |
|
|
Science-based targets initiative |
Corporates |
Yes |
No |
No |
|
|
UNGC and B-Lab |
Corporates |
No |
No |
No |
|
|
WBCSD GRI UNGC |
Corporates |
Yes |
No |
No |
|
|
De Nederlandsche Bank (DNB) |
Investors |
Yes |
No |
No |
|
|
UNDP |
Both |
No |
No |
Yes |
|
|
Sustainable Development Investments (SDI): SDI Asset Owner Platform |
APG PGGM |
Investors |
No |
Yes |
Yes |
|
The Task Force on Climate-related Financial Disclosures (TCFD) |
Both |
No |
No |
No |
|
|
Toward Common Metrics and Consistent Reporting of Sustainable Value Creation |
World Economic Forum and Big Four (PwC, EY, KPMG and Deloitte) |
Corporates |
Yes |
No |
No |
|
Transition Pathways Initiative |
Both |
No |
Yes |
Yes |
|
|
United Nations |
Governments |
Yes |
No |
Yes |
|
|
United Nations Conference on Trade and Development: International Standards for Accounting and Reporting (ISAR) |
Corporates |
Yes |
No |
Yes |
|
|
World Benchmarking Alliance (WBA) |
Investors |
No |
Yes |
Yes |
|
|
WikiRate |
Both |
No |
Yes |
No |
Appendix 2: Tools (Climate outcomes)
Illustration of how various existing tools for investor action can be mapped against each part of the proposed framework, using climate as an example
| Investment decisions | Stewardship of investees | Engagement with policymakers | Disclosure and reporting | |
|---|---|---|---|---|
|
1. Identify outcomes Investors identify and understand the unintended outcomes from current investment activities |
|
|||
|
2. Set policies and targets Investors set policies and targets for their intentional activities to reduce negative outcomes and increase positive ones. |
|
|||
|
3. Investors shape outcomes Investors individually seek to increase positive outcomes, decrease negative outcomes and measure progress toward established targets. |
|
|||
|
4. Financial system shapes collective outcomes Investors collectively seek to increase positive outcomes, decrease negative outcomes and measure collective progress. |
|
|
|
|
|
5. Global stakeholders collaborate to achieve outcomes in line with the SDGs Investors work with broader stakeholders – including businesses, governments, academia, NGOs, consumers, citizens and the media – to globally achieve all SDGs. |
|
|||
Appendix 3: Investor examples
Actiam
Actiam
Type of investor:
Investment manager
Country:
Netherlands
AUM:
€63 billion
We have set an objective to contribute to the SDGs with our investments, however, not all investments clearly measure their impact. To improve SDG impact measurements and reporting, we engage investees by asking questions during issuer roadshows.
This has included encouraging regional development banks and other sub-sovereign issuers to follow the best practices of early movers such as the European Investment Bank, which provides the following impact/output metrics:
- annual carbon emissions of the project, including absolute emissions (gross emissions) and avoided emissions (relative emissions against the baseline);
- renewable energy capacity added (in MW);
- energy (heat and electricity) saved (in MWh);
- location of the projects (in the context of access to energy).
We also seek to test whether a given green bond makes a substantial and additional contribution to SDG 7. First, we ensure that the issuer reports on measurable impact across the three investable sub-goals:
- 7.1: Ensure universal access to affordable, reliable and modern energy services
- 7.2: Increase share of renewable energy
- 7.3: Double the global rate of improvement in energy efficiency
We then analyse whether the use of proceeds accelerates or follows the issuer’s efforts to shift towards greener activities, by assessing whether the issuer defines quantified upfront hurdle rates or eligibility thresholds that go beyond national standards and regulations.
Where possible, we ask issuers to quantify and report on their impact in relation to the SDGs. However, to assess the impact on less quantified SDGs, we also use qualitative information from the issuer.
In early 2018, we engaged with an investee global financial services group on its contribution to SDG 7.3. Based on its definition of green buildings, we concluded that the risk of locking in weak energy efficiency performance levels was too great. The issuer responded positively to our request to include a more ambitious hurdle rate, committing to only finance projects with efficiency improvements of at least 30%. The issuer also agreed to finance green buildings that are in the top percentile of the local market, thereby aligning with market best practices.
A longer case study on ACTIAM’s engagement work with green bond issuers is available here .
Actis
Actis
Type of investor:
Investment manager
Country:
UK
AUM:
US$12 Billion
The Actis Impact Score (AIS) is an in-house tool we developed to identify, measure and monitor the positive social and environmental outcomes of our investments. It allows us to compare across sectors and regions, e.g. evaluating the potential for positive outcomes from a renewable energy company in India, versus an educational investment in Africa. At the outset of any investment, we target a certain AIS to be achieved by exit. The AIS can be measured throughout the investment period. As well as the absolute impact score, the impact multiple – the increase in positive outcomes (impact) during our holding period – is a crucial measure for us to gauge the outcome performance of investments. Moreover, by aligning the AIS with the SDGs, this enables us to present the positive outcomes of our investment decisions using a common language.
From each investment we identify up to five positive outcomes for people or the planet. For each, we then:
- Assess the significance of the impacts to be achieved, in terms of depth and duration of the change in outcomes.
- Evaluate the number of people set to benefit from the investment, and how well-served they will be – e.g. changing outcomes for many marginalised, vulnerable or under-served people would score highly.
- Assess additionality, considering what level of outcome would occur anyway without our investment.
- We then add the scores and multiply by a factor according to whether outcomes are shaped by:
- a core business activity (x5) – e.g. a renewable energy investment reducing the carbon intensity of a grid;
- an ancillary business activity (x3) – e.g. a positive outcomes for people in the primary supply chain;
- a peripheral activity (x1) – e.g. the result of a charitable or philanthropic gesture.
Finally, we assess the risk of the intended impact (change in outcome) not happening. This is considered alongside the score when making investment decisions.
For example, we used the AIS to assess the change in outcomes generated in line with the SDGs through investment in a renewable energy platform in India – Ostro Energy – which focused on the construction of wind power and solar energy projects. Within four years of its inception, Ostro had signed long-term power purchase agreements (PPAs) totalling 1.1 gigawatts in states where 54% of power was generated from coal ( of which 850MW was operational at the time of Actis’ exit from the investment ). The company also created more than 4,500 jobs for Indian workers, with a strong emphasis on worker welfare, and made further investments in local community projects, such as to improve drinking water.
These measurable outcomes of the project – as calculated by the AIS – were mapped to the SDGs prior to Actis’ exit in 2018. For newer investments, we are reviewing impact scores on an annual basis in order to give a clear indication of progress – or not – towards the initial outcomes forecast. If the business in underperforming, we seek to correct that alongside the deal team and management. Given that our intended outcomes are closely aligned with the business case, investments that are underperforming on outcomes are typically underperforming commercially, and so corrective actions are usually implemented in collaboration with the deal team.
Andra AP Fonden (AP2)
Andra AP Fonden (AP2)
Type of investor:
Asset owner
Country:
Sweden
AUM:
SEK381.3 billion
Since 2016, we have been engaged in a project to enhance the integration of human rights issues in our investment decisions (focusing on listed global equities), assisted by Shift (an expert on the UN Guiding Principles on Business and Human Rights (UNGPs)). We manage most of this asset class quantitatively, taking small holdings in a large number of portfolio companies that are active across the globe in different sectors. The diversity of the holdings was both a driver and a key challenge for establishing a clear idea of the risks across the asset class.
Our analysis sought to identify the negative human rights outcomes that would be common to sectors in which portfolio companies operate. We also looked at whether portfolio companies operated in a particular context or region considered highly vulnerable to human rights abuses, and whether the companies had instituted policies and processes for managing these risks.
In determining the severity of potential human rights outcomes, special attention was paid to the scale, scope and irremediable character of those outcomes. For example, risks in an industry with wide-ranging problems such as the use of slave labour would be assessed as severe, both in terms of the scale and the scope of the negative outcomes. Activities where vulnerable groups such as women, children, minorities or indigenous peoples might be adversely affected were also deemed severe (and therefore would be prioritised).
One insight from this process was the challenges that arose in prioritising the identified negative human rights outcomes (potential or existing): most of the sectors we analysed were assessed as having potential severe negative human rights outcomes, including 40 sub-sectors, but there was limited data available on those outcomes at a company level.
As a result of the findings from the first analysis, we aim to develop an in-house quantitative data model that can provide a more adequate and complete picture of negative human rights outcomes. Information, that AP2 can then use to decide which outcomes to prioritise. The model will systematically analyse and monitor specific issues, such as how the risk of child labour is changing in different sectors and countries over time.
Aviva Investors
Aviva Investors
Type of investor:
Investment manager
Country:
UK
AUM:
US$424 billion
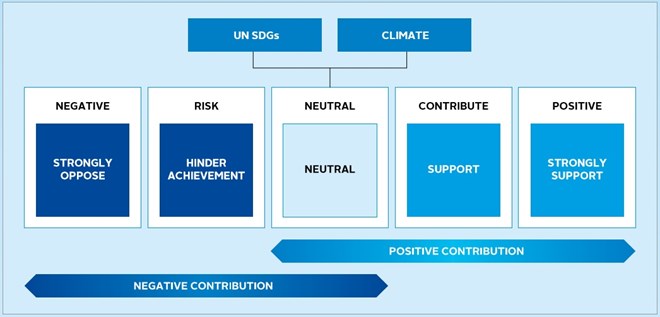
Our real assets business uses the SDGs as a framework to assess whether a project contributes positively toward environmental and social outcomes. The responsible investment team apply an ESG-balanced scorecard approach to analyse proposed transactions, complemented by an impact overlay to consider a project’s potential contribution to the SDGs (per the figure below). The team works closely with origination and investment teams to apply this framework, which will ultimately support decisions by the investment committee.
As an example, we were considering financing a European utility, whose main business is supplying localised energy, with a strong focus on efficiency improvements. The company had a roadmap for reducing the carbon footprint of its operations, but still supplied energy generated from coal (albeit this exposure was declining).
Before investing, we wanted additional assurance that the company would adhere to its decarbonisation plans, so we imposed an ESG-specific covenant onto an infrastructure debt issuance, prohibiting the building of any new coal plants and including tight limits on transaction activity linked to coal (e.g. acquiring any company or business that is in the process of building any coal plants). Reporting obligations were also included in the agreement, ensuring that we are kept up-to-date with progress of the decarbonisation programme.
Figure 5: Developing impact model to align ESG Social/Development
CAISSE DES DÉPÔTS AND CONSIGNATIONS (CDC)
CAISSE DES DÉPÔTS AND CONSIGNATIONS (CDC)
Type of investor:
Asset owner
Country:
France
AUM:
€430 billion
In 2019 we initiated a group-wide project to assess and increase our business units’ contribution to the SDGs.
Our goals were to:
- pilot how each unit implements and accounts for our new corporate mission: “reducing social and territorial inequalities”;
- better articulate financial, strategic and sustainability management processes.
The project is structured around an SDG-balanced scorecard – an action plan for each business unit to improve its contributions. These are defined as intentional actions implemented to improve each unit’s positive impact, or reduce its negative impact, on one or more SDG targets.
The scorecard has been defined through a bottom-up materiality analysis to reflect the diversity of our activities and their impacts. With the assistance of the responsible investment team, each unit first rated the positive and negative impacts of their activities on the different SDG targets, and then identified potential actions that could be implemented to improve them. Based on this mapping, each unit drew up its action plan by using three types of criteria: real economy impact; contribution to operational efficiency; strategic alignment.
The resulting SDG scorecards for each business unit were consolidated at Group level into:
- “priority SDGs”, where the ambition is to improve the impact through close integration into management processes (SDGs 4, 7, 8, 9, 10, 11 and 13);
- “significant SDGs”, which are significant for some activities and require close monitoring to ensure the impact does not worsen (SDGs 3, 5, 12, 15 and 17).
Depending on the business unit and SDG target, action may take different forms, including:
- strengthening due diligence;
- prioritising an issue in the shareholder engagement program;
- increasing thematic allocation;
- integration into corporate management policy (e.g. HR, facility management).
As an example, for the priority SDG on climate change (SDG 13), our action plan is focused on increasing allocations that support the transition to a low-carbon economy, strengthening our fossil fuel policy (exclusion, analysis and engagement), aligning portfolios’ carbon footprints reduction targets with the target of net zero emission in 2050 and achieving carbon neutrality across our own scope 1 & 2 emissions. Each unit has specific actions in place to implement these policies in line with their activities and mandates. The overall group scorecard is approved by the executive board and integrated into strategic planning. The SDG taskforce is now defining processes and indicators to enable the board to monitor implementation, with the aim of defining associated performance targets by 2021.
Nomura asset management
Nomura asset management
Type of investor:
Investment manager
Country:
Japan
AUM:
US$494 billion
To contribute to SDG 3 – the goal of ensuring healthy lives and promoting well-being for all at all ages – we are focused on supporting target 3.3: ending the epidemics of AIDS, tuberculosis, malaria and other communicable diseases by 2030.
The largest global HIV drug makers not only invest billions of dollars to develop ever more effective pharmaceutical solutions, but also make significant investments and commitments towards ensuring broad access to those solutions. “Access” ranges from donating patents, to patent pools (allowing generic drug manufacturers to produce patented drugs to distribute in developing economies at vastly reduced prices), to directly donating drugs and funding patient access programmes.
To track an investee company’s contribution to reducing global mortality rates from HIV, we monitor the following metrics:
- patients receiving HIV treatment in low/middle income countries;
- investment in R&D.
We are also a co-lead investor (since September 2019) on a 98-investor collaborative engagement on access to medicine. The Access to Medicine Foundation supports broadening access strategies, expanding the number of drugs covered under voluntary licensing agreements and increasing the number of countries covered.