

Overview
- This introductory guide provides a brief overview of climate metrics that are currently widely used by investors, based on PRI reporting data and asset managers’ public climate disclosures.
- The purpose of the guide is to highlight current market practice; it does not recommend the climate-related metrics that investors should disclose.
- This guide is for asset owner employees with limited or no prior knowledge of climate metrics.
- In late 2021, the Taskforce on Climate-related Financial Disclosures (TCFD) recommended all organisations disclose data across seven cross-industry metrics categories. This guide covers four of them: greenhouse gas emissions, transition risks, physical climate risks and climate-related opportunities.
Why are climate metrics used?
Climate metrics enable investors to:
- understand and manage climate-related risks, opportunities and impacts associated with their investments;
- track progress against goals, such as reaching net-zero greenhouse gas emissions by a specified date;
- comply with regulatory reporting requirements;
- inform beneficiaries of climate-related risks, opportunities and impacts associated with their investments; and
- conduct climate-focused stewardship, either independently or in collaboration.
PRI resources
This section of the report covers the following climate metric categories:
- greenhouse gas emissions;
- transition risks;
- physical climate risks;
- climate-related opportunities;
- climate value at risk;
- portfolio alignment; and
- climate stewardship.
Greenhouse gas emissions metrics
What are greenhouse gas emissions metrics?
Greenhouse gases (GHGs) are gases in the earth’s atmosphere that trap heat, causing climate change. GHGs include carbon dioxide, methane, nitrous oxide and other fluorinated gases. Figures on GHG emissions are often expressed in tons of carbon dioxide equivalent (CO2e). CO2e is used to compare various GHG emissions based on their global warming potential.1
The TCFD recommends disclosing absolute Scope 1, Scope 2, and Scope 3 GHG emissions, as well as emissions intensity metrics.2
Disclosures of absolute emissions metrics are often made in line with the GHG Protocol standards, which categorise emissions into three scopes:
- Scope 1 emissions are the direct GHG emissions that occur from sources that are controlled or owned by the reporting organisation (e.g., emissions that result from fuel combustion in furnaces and vehicles).
- Scope 2 emissions3 are indirect GHG emissions associated with the purchase and use of electricity, steam, heat, or cooling by the reporting organisation.
- Scope 3 emissions4 result from activities and assets not owned or controlled by the reporting organisation, but that the organisation indirectly impacts in its value chain (e.g., transportation and distribution, purchased goods and services).
What are some examples of relative GHG emissions metrics?
Many PRI signatories report on their GHG emissions on a relative (normalised) basis. They do this by dividing GHG emissions by a common denominator, such as revenue. These normalised metrics facilitate comparisons of investments and portfolios of different sizes. Examples of reported relative metrics include:
- Carbon intensity: volume of carbon emissions per million dollars of revenue, expressed in tons CO2e / USD$M revenue.
- Weighted average carbon intensity (WACI): a portfolio’s exposure to carbon-intensive companies, expressed in tons CO2e / USD$M revenue.
- Carbon footprint: total carbon emissions for a portfolio normalised by the market value of the portfolio, expressed in tons CO2e / USD$M invested.5
Investors should be mindful that GHG emissions metrics are often based on partial data, because not all assets / entities report accurately and consistently on their emissions, and data providers use a range of methodologies to fill in the gaps.
What are ‘avoided emissions’?
Some investors report on the avoided emissions associated with their portfolios. The term relates to the reduction in GHG emissions that occurs as a result of activity undertaken by an entity or portfolio.
Avoided emissions metrics have caused concern, with some viewing them as a way to water down companies’ and investors’ net-zero targets. There are also concerns regarding the varying methodologies used to calculate avoided emissions metrics.6
However, organisations working to combat climate change, including the World Resources Institute, recognise that avoided emissions metrics, when calculated in a consistent and credible way, can provide insight into the positive impacts that an asset delivers.7
Investor disclosures
- Montpensier Finance discloses the weighted average carbon intensity of its portfolio, and that of the reference benchmark. It also includes data on the percentage of portfolio holdings for which carbon emissions data is available (see p.25): https://montpensier.com/wp-content/uploads/fonds/m-climate-solutions/m-climate-solutions_rapport-annuel_en.pdf
- Investindustrial discloses historical data on the carbon footprints of its individual funds (see p.108): https://www.investindustrial.com/dam/Investindustrial/AR2020/AnnualReview2020_printable.pdf
PRI resources
Transition risk metrics
What are transition risks?
Transition risks are those associated with the global shift towards a low-carbon economy. The most common transition risks relate to policy and legal actions, technology changes, market responses and reputational considerations.
What are some examples of transition risk metrics?
Climate-related transition risk metrics are useful to understand and assess how an investment or portfolio is set to be impacted by the transition to a low-carbon economy. Several climate-related transition risk metrics are reported by PRI signatories. These include:
- Portfolio exposure to assets that could become stranded. (Stranded assets are those that have premature or unanticipated write-downs, dilutions, or conversion into liabilities.)
- Exposure to carbon-related assets. The TCFD defines this metric as the amount or percentage of carbon-related assets in the portfolio, expressed in USD$M or percentage of the current portfolio value.8
- Net Asset Value (NAV)9 exposure to different energy sources (coal, oil, gas, etc.).
Investors should be mindful that, while there is a degree of convergence, organisations continue to take different approaches to calculating these metrics, which limits the comparability of the data.
Investor disclosures
- Australian Ethical discloses fossil fuel reserves per AU$1m invested (see p.41): https://www.australianethical.com.au/globalassets/pdf-files/sustainability-reports/ae-2021-sustainability-report-webi.pdf
- Carmignac discloses the proportion of its portfolio invested in securities that generate revenues from fossil fuels. This metric is also provided for the reference benchmark (see p.7): https://carmidoc.carmignac.com/SRICA_UK_en.pdf
Physical climate risk metrics
What are physical climate risk metrics?
A physical climate risk relates to the physical hazards caused by climate change. These hazards can be acute or chronic. Acute hazards consist of severe and extreme events and are location-specific; examples include wildfires and droughts. Chronic hazards relate to long-term incremental changes, such as variation in precipitation levels and ocean acidification.10
Physical risk metrics seek to indicate the vulnerability11 of investments to physical climate hazards.
Calculating these metrics involves assessing the geographic location(s) where assets / entities are based12 and their exposure to physical climate hazards. Assets / entities are also assessed on their capacity to effectively manage and respond to physical climate risks.
Physical risk metrics provide an insight into if / how investment managers are monitoring and managing the climate-related physical risks associated with their portfolios. However, investors should be aware of methodological differences, limited data coverage and data quality issues.
What are some examples of physical climate risk metrics?
Examples of metrics reported by PRI investment manager signatories include:
- % of portfolio exposed to issuers with operations located in geographical areas sensitive to physical risks;
- % of portfolio exposed to issuers in sectors sensitive to physical risks;
- % of properties in real estate portfolios located in areas at high risk of sea level rise and extreme weather events; and
- physical risk score for the portfolio by 2050 under 3°C and 4°C climate change scenarios.
Investor disclosure
Charter Hall Group assesses the levels of current and future physical risks that different sections of its real assets portfolio are exposed to under different climate scenarios (see p.5): https://www.charterhall.com.au/docs/librariesprovider2/corporate-documents/annual-reports/sustainability-other-documents/tcfd-final-2021.pdf?sfvrsn=c109db84_4
Climate-related opportunity metrics
What are climate-related opportunity metrics?
Climate-related opportunity metrics measure the proportion of assets, revenues, or other business activities aligned with opportunities13 associated with the transition to a low-carbon economy. These opportunities can relate to climate change mitigation or adaptation. Climate change mitigation involves avoiding and reducing GHG emissions, while adaptation is the process of adjusting to current or expected climate change and its effects.14 Climate-related opportunity metrics can be expressed as an amount or as a percentage.
What are some examples of climate-related opportunity metrics?
There are a significant number of different climate-related opportunity metrics reported by PRI signatories. These include:
- % of portfolio companies’ revenue generated from green / clean technology and from other climate solutions;
- % of the portfolio invested in renewable energy assets;
- NAV exposure to renewable energy; and
- % of the portfolio contributing to Sustainable Development Goal (SDG) 7: Affordable and Clean Energy and to SDG 13: Climate Action.
A limitation of some of these metrics is that they are not clearly defined. For example, definitions of what constitutes a ‘climate solution’ vary. Metrics reported in relation to recognised frameworks, such as the SDGs, are more transparent and comparable.
Investor disclosures
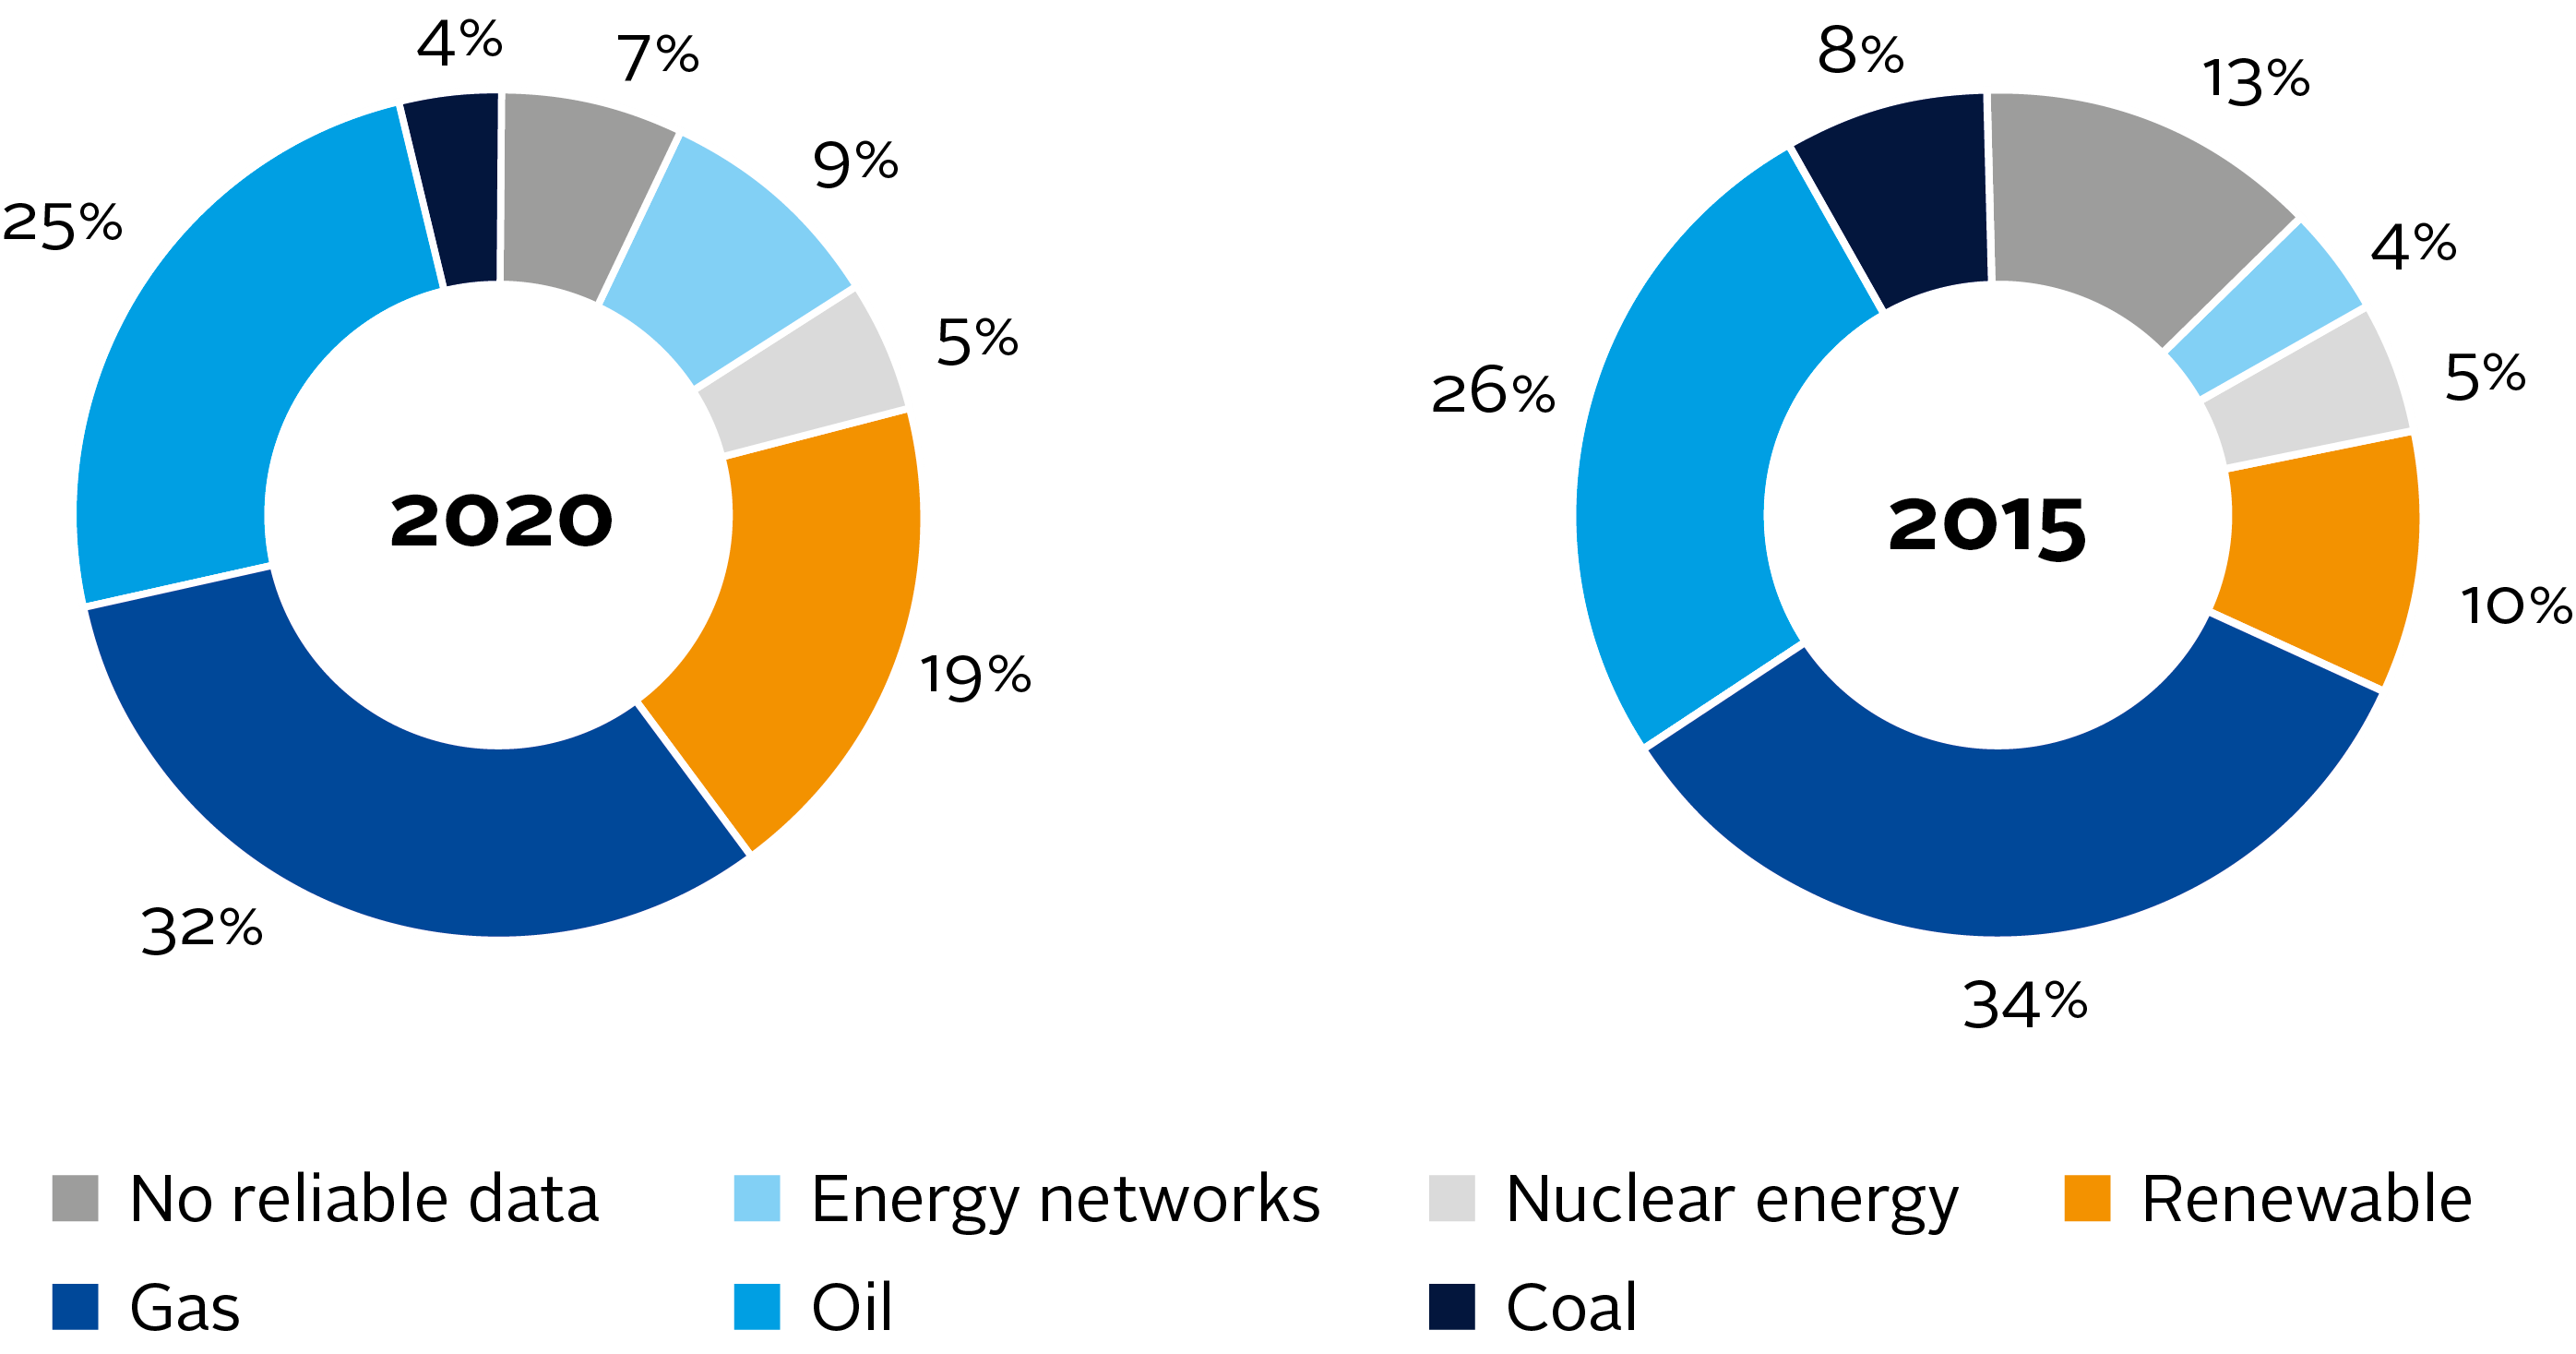
- In its 2020 Responsible Investment Report, APG discloses the percentage of its energy investments that are in renewables. It also provides data on how its energy investment mix has evolved over time. Figure 1: Breakdown of APG’s energy investments by type Source: APG (2020), Responsible Investment Report, p.38
- The 2020 responsibility and impact report for the ACTIAM Financial Inclusion Fund discloses the percentage of investees whose mission objectives contribute to SDGs 7 and 13 (see pp.17-18). ACTIAM also describes how it assesses SDG contribution (see p.11): https://www.actiam.com/4a5e5b/siteassets/6_fondsen/impact-investing/actiam-institutional-microfinance-fund-iii/afif-responsibility-impact-report-2020.pdf
Figure 1: Breakdown of APG’s energy investments by type. Source: APG (2020), Responsible Investment Report, p.38
Climate value at risk metrics
What are climate value at risk metrics?
Climate value at risk (VaR) metrics are forward-looking estimates of the loss or gain an asset or portfolio may experience under different climate scenarios, within a given time horizon, at a particular probability15 (e.g., at a 25% or 50% likelihood).
Scenario analysis can be used to calculate climate VaR metrics. Conducting scenario analysis is a process that involves identifying and assessing the potential implications of a range of plausible future scenarios (e.g., a 2°C, or greater than 2°C, rise in average global temperatures).
Climate VaR metrics are expressed as a percentage and / or as a value in a selected currency. They can be positive or negative, as some investments stand to gain under certain climate scenarios, whilst others will lose value. For example, an investment manager may report that their real estate portfolio has a climate VaR of -2.3% under a 1.5°C scenario, whilst one of their thematic listed equity funds has a climate VaR of +0.5% under the same scenario.
The climate VaR metric expresses an overall estimate of financial impact, encompassing transition risks, opportunities and physical risks. Some investment managers report physical climate VaR as a standalone metric in addition to overall climate VaR.
A key use of climate VaR metrics is to assess the climate-related risks and opportunities facing an asset or portfolio. A limitation of the metric is that estimates are highly sensitive to modelling assumptions.16
Investor disclosures
- AXA Investment Managers discloses climate VaR figures under a 1.5° C scenario for its portfolio and the reference benchmark (see p.37): https://www-axa-com.cdn.axa-contento-118412.eu/www-axa-com/db5d9f4b-4bb9-4029-ad51-b9e0e20301fb_2021_Climate_Report.pdf
- Aviva Investors discloses climate VaR impact estimates under four different temperature scenarios for its shareholder funds (see p.22): https://www.aviva.com/content/dam/aviva-corporate/documents/socialpurpose/pdfs/climate-related-financial-disclosure-2020-report.pdf
PRI resources
Portfolio alignment metrics
What are portfolio alignment metrics?
Portfolio alignment metrics express the extent to which an investment or portfolio is aligned with particular goals, for example the Paris Agreement or the SDGs. These metrics can be expressed as a percentage or as a number in degrees Celsius.
There is some overlap between portfolio alignment and climate-related opportunity metrics, but they can be used in different ways. Portfolio alignment metrics can be used to measure the environmental and social impact resulting from investments. Climate-related opportunity metrics can be used to help assess the financial returns that an investment or portfolio is set to generate from the transition to a low-carbon economy.
What are some examples of portfolio alignment metrics?
Examples of metrics reported by PRI signatories include:
- % of the portfolio aligned with the EU taxonomy;
- % of the portfolio contributing to the SDGs (7 and 13); and
- implied temperature rise (ITR) associated with the portfolio.
Implied temperature rise metrics are forward-looking and attempt to estimate a global temperature rise associated with the GHG emissions of a single entity (e.g., a company) or a selection of entities (e.g., those in an investment portfolio or strategy).17
There are varying approaches to calculating ITR metrics. The process generally involves assessing an investee’s GHG emissions trajectory, based on its current GHG emissions and carbon reduction targets. The trajectory is assessed for alignment with decarbonisation pathways, such as those developed by the Transition Pathway Initiative, and carbon budgets, to produce an implied temperature rise score for the portfolio holding. Scores for individual holdings can be aggregated at the portfolio level.
ITR metrics can be useful in communicating a portfolio’s exposure to climate-related risks and opportunities. However, challenges include varying calculation methodologies and coverage. The PRI recommends that ITR metrics should not be viewed in isolation but considered alongside a range of additional climate metrics.18
Investor disclosure
In its 2020 climate report, Amundi published the implied temperature score for its equity, fixed income and other investment portfolios alongside the implied temperature score of the MSCI World Index (see p.39): https://www.amundi.com/institutional/files/nuxeo/dl/d369653e-07d2-43e2-a02e-c6980767237b
PRI resources
Climate stewardship metrics
What are climate stewardship metrics?
Investors can use their stewardship activity to support the transition to a low-carbon economy. This involves engaging with investee and other relevant entities on climate-related issues. For listed equity investors, it also involves voting on climate-related annual general meeting and extraordinary general meeting items. Climate stewardship metrics capture activity that has been undertaken and results achieved.
What are some examples of climate stewardship metrics?
Quantitative climate-related stewardship metrics reported by PRI investment manager signatories include:
- % of climate-related shareholder proposals supported;
- % of climate-related shareholder proposals opposed;
- % of votes against management on the grounds of climate risk concerns; and
- number of climate-related engagements conducted in the past 12 months as a % of the total.
The PRI recommends that stewardship disclosures should include not only processes but also information on the real-world outcomes that result from engagement and voting activities.
Investor disclosure
In its 2020 ESG report, Neuberger Berman discloses the number of shareholder resolutions on climate change that were supported / opposed in absolute and percentage terms (see p.65). It also provides rationales for some of its key votes (see pp.59-60): https://www.nb.com/handlers/documents.ashx?id=5b10af77-6d0d-451b-84ee-7aeb12bbcf9c
PRI resources
Climate metrics will continue to evolve as mandatory reporting requirements develop and additional standards are produced by investor alliances. Recent and ongoing developments of note are listed below.
- The TCFD recently recommended that organisations disclose data across seven cross-industry, climate-related metric categories.19
- In November 2021, the IFRS Foundation announced the creation of the International Sustainability Standards Board, which would develop a global baseline of sustainability-related disclosure standards designed to help investors assess enterprise value, starting with climate-related disclosures.
- The European Financial Reporting Advisory Group (EFRAG) is developing sustainability reporting standards,20 including on climate, adopting an approach that considers how sustainability issues affect a company’s performance, position and development, and a company’s impact on people and the environment. Once these standards are in place, they are also likely to help shape the climate metrics investors use and report.
This introductory guide will be updated periodically to reflect changes in the use and reporting of climate metrics by investors globally. Any feedback or questions regarding this guide can be sent to [email protected]
Downloads
Introduction to Responsible Investment - Climate Metrics
PDF, Size 1.02 mbIntroduction to Responsible Investment - Climate Metrics (Spanish)
PDF, Size 2.94 mbAn Introduction to Responsible Investment: Climate Metrics (Chinese)
PDF, Size 1.48 mb
References
1 OECD (2001), Environmental Indicators for Agriculture – Vol. 3: Methods and Results
2 TCFD (2021), Task Force on Climate-related Financial Disclosures Guidance on Metrics, Targets, and Transition Plans, p.16
3 EPA, Scope 1 and Scope 2 Inventory Guidance
4 EPA, Scope 3 Inventory Guidance
5 TCFD (2017), Annex to the Implementing the Recommendations of the Task Force on Climate-related Financial Disclosures report
6 Stephen Russell and Yelena Akopian (2019), Greenhouse Gas Protocol, Many companies inaccurately estimate the climate benefits of their products
7 World Resources Institute (2013), Do We Need a Standard To Calculate “Avoided Emissions”?
8 TCFD (2021), Implementing the Recommendations of the Task Force on Climate-related Financial Disclosures, p.4
9 The NAV of a fund is calculated by dividing the total net value of the fund (the value of all assets minus the value of all liabilities) by the fund’s current total number of shares outstanding. See: CFA, Chapter 14, Investment Vehicles, pp.37-8:
10 Basel Committee on Banking Supervision (2021), Climate-related financial risks -measurement methodologies, p.5
11 IPCC (2001), Climate Change 2001: Synthesis Report, p.388
12 Basel Committee on Banking Supervision (2021), Climate-related financial risks -measurement methodologies, pp.13-14
13 TCFD (2021), Task Force on Climate-related Financial Disclosures Guidance on Metrics, Targets, and Transition Plans, p.16
14 NASA, Responding to climate change: mitigation and adaptation
15 TCFD (2017), Recommendations of the Task Force on Climate-related Financial Disclosures, p.3
16 PRI (2021), Forward looking climate metrics, p.6
17 TCFD (2020), Forward-looking financial sector metrics, p.7
18 PRI (2021), Forward looking climate metrics, p.5
19 These categories are: GHG emissions metrics, transition risk metrics, physical risk metrics, climate-related opportunities metrics, capital deployment metrics, internal carbon prices and renumeration metrics. See pp.16-17: https://www.fsb.org/wp-content/uploads/P141021-2.pdf
20 Finalised versions of these standards will be adopted through Delegated Acts by the European Commission and constitute reporting requirements under the proposed Corporate Sustainability Reporting Directive